by Kyle Conway
Is North Dakota’s oil boom over?
Consider these statistics. In November 2012, there were 191 active rigs drilling new wells in North Dakota. A year later, in November 2013, there were 181. November 2014: 188. November 2015: 64. November 2016: 38 [note 1]. The state’s oil boom, these statistics suggest, peaked in 2014, and now, only two years later, it’s clear the state’s in a bust.
Now consider some competing statistics. In 2012, North Dakota produced a little more than 240 million barrels of oil. In 2013, that number rose to about 314 million. In 2014: 397 million. In 2015: 432 million [note 2]. (See Figure 1.) Not only that, but oil production in 2015 was more than eight times what it was at the height of the last boom in the 1980s. These numbers tell a different story: whatever the decline in active rigs, the boom is still kicking.
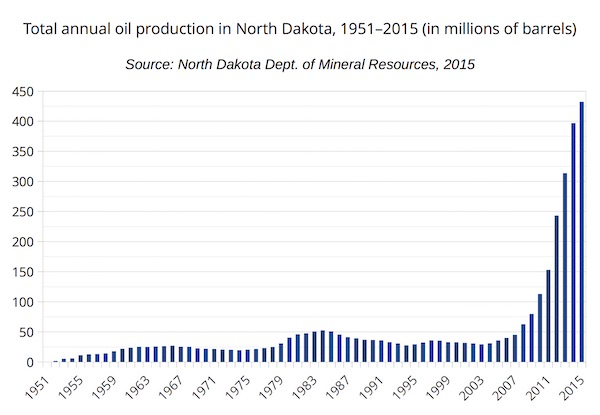
Figure 1
So which is it – is the boom over or not? These statistics suggest that the answer is not a simple either/or. If we define a boom merely as an expansion of production (and a bust as a contraction), we miss the more complex relationships between drilling, oil production, and oil revenue. The contraction the Bakken has experienced since 2014 was built into its boom from the beginning. It was always taking place, even during the peak years of 2008–2014, because wells quickly became inefficient. It was just hidden by the furious pace of drilling. When oil prices dropped, that pace became unsustainable, and the contraction that was always imminent became real.
In this post and the next, I want to explore the implications of this observation. I argue that the boom is not over, in at least two senses. First is that of economics: as I suggest above, the boom from 2008–2014 was premised – paradoxically – on a contraction. Oil companies could postpone it, but they could not escape it. In that sense, the fundamental conditions of oil extraction have remained the same. What’s more, the bust – even now – has boom-like qualities, as production remains at near-record levels. In this sense, the terms North Dakotans use are misleading. The passage from expansion to contraction has been characterized by far more continuity than words like “boom” and “bust” seem to imply.
The second sense is that of people’s lived experience. This will be the topic of the next post. But in short, my argument is this: economic conditions (and contradictions) have a profound impact on people’s lives, and the continuity we see in the economics of oil extraction translates into a continuity in the ways people live in the Bakken.
My point is to raise questions as much as to answer them. If I’m being polemical (and I am), it’s to provoke reactions. I hope this is the beginning of a conversation. Think I’m wrong? Tell me why. Click on the “contact us” tab above and send me a message. We (the editors of this site) would love to have your contribution.
The built-in contraction
What does it mean to say that the boom was premised on a contraction? Fracked wells produce oil most quickly during the first month after they come on line. After a year, their production drops as much as 50 percent, and after two years, as much as 70 percent. As a result, during the height of the Bakken boom, oil companies had to drill about ninety new wells a month just to hold production steady [note 3], and the number of active wells ballooned from about 4,200 in 2008 to more than 13,700 in 2015 [note 4]. (See Figure 2. For a useful point of comparison, note that there were about three and a half times as many wells in 2015 as there were at the height of the 1980s boom.) In other words, many of the jobs created during the boom were those of the people who worked the drilling rigs. Their work was in demand because oil companies knew the wells they drilled would slow down in a relatively short time.

Figure 2
At the same time, however, the technology for extracting oil from shale was becoming more efficient: steerable rotary bits, multipad drilling (where “multiple descending wells from a single surface location eliminate the need for rig transfers between locations”), and zipper fracking (where “two or more parallel wells are drilled by perforating each at alternating intervals”) made it possible to drill wells faster and extract more oil from them [note 5]. In the Bakken, these improvements translated into wells that produced twice as much oil annually than those from the 1980s boom [note 6]. (See Figure 3. Note that the statistics from the 1950s are thrown off by the fact that there were very few wells, which has the effect of inflating the annual average production per well.)
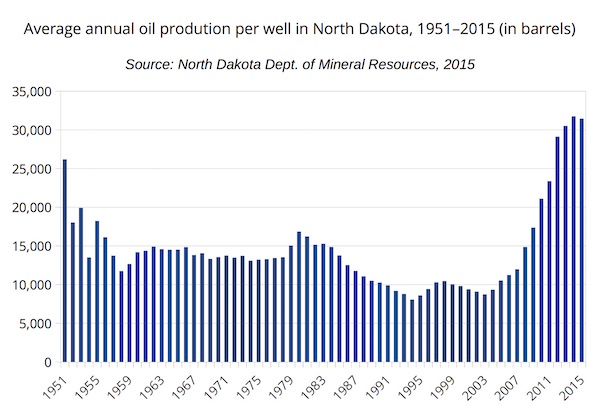
Figure 3
So is the boom over?
What we have is a set of factors that push and pull on each other. On the one hand, drilling is down 80 percent from its peak in 2012–2014. On the other, wells are more efficient than in the past, even if their productivity does drop off over time. On top of that, the state has more wells than ever, producing more oil than ever. So even if the industry is not expanding at the same pace as before, its contraction doesn’t seem as dire as the gloomy headlines would suggest.
Of course, rates of drilling and production are only part of the story. The price of oil is another. Its precipitous drop in 2014 caused the drop in drilling – the break-even point for oil companies was about $85 a barrel. Any less and new wells weren’t profitable [note 7]. Cheap oil also hurt North Dakota’s tax revenues. Despite the fact that production remained high, the state had to cut its budget in 2016 because its revenue predictions didn’t account for the falling price of oil [note 8]. And yet, that too could change, according to Harvard’s Leonardo Maugeri: “shale activity can be resumed outright if oil prices later would resume their upward climb” [note 9].
So where does that leave North Dakotans? How have longtime residents and the people who came during the boom experienced the push and pull of the different factors that shape oil production in the state? That will be the topic of my next post.
Notes
Note 1. North Dakota, “Current Active Drilling Rig List,” Bismarck: North Dakota Industrial Commission, Department of Mineral Resources, 2016.
Note 2. North Dakota, “Oil in North Dakota: 2015 Production Statistics,” Bismarck: North Dakota Industrial Commission, Department of Mineral Resources, 2015, p. xiv. A spreadsheet with the table from which Figures 1–3 derive is available here.
Note 3. Leonardo Maugeri, “The Shale Oil Boom: A U.S. Phenomenon,” Discussion Paper 2013-05, Cambridge, MA: Harvard Kennedy School, Belfer Center for Science and International Affairs, 2013, p. 1–3.
Note 4. North Dakota, “Oil in North Dakota,” p. xiv.
Note 5. Maugeri, “The Shale Oil Boom,” p. 8.
Note 6. North Dakota, “Oil in North Dakota,” p. xiv.
Note 7. Maugeri, “The Shale Oil Boom,” p. 14.
Note 8. See, for instance, Mike Nowatzki, “ND Tax Revenues Fall Short Again; More Budget Cuts Possible,” Grand Forks Herald, March 15, 2016.
Note 9. Maugeri, “The Shale Oil Boom,” p. 14.
