Sixty Years of Boom and Bust

A year ago I wrote about my project to update The Williston Report, published in 1958 right after the first oil boom in western North Dakota.

That project has kept me busy, but I’ve finally submitted the manuscript to the Digital Press at the University of North Dakota. I hope to hear back with peer reviewers’ comments in six or eight weeks. (It’s a 500-page manuscript. The reviewers can take their time.)

In the meantime, I’m planning — finally! — to post more about what makes the 2008-14 boom interesting, especially in comparison to the 1950s boom. I plan to post highlights of each chapter, starting with the two introductions (mine from 2018 and that of the authors of the original report from 1958). But first, the table of contents:

Section I. Introduction

Chapter 1. Introduction: Sixty Years of Boom and Bust (2018), by Kyle Conway
Chapter 2. Introduction and Summary (1958), by Bernt L. Wills, Ross B. Talbot, Samuel C. Kelley, Jr., and Robert B. Campbell

Section II. Physical Geography

Chapter 3. Physical Attributes of the Area (1958), by Bernt L. Wills
Chapter 4. The Geographic Setting of the Bakken Oil Shale Play (2018), by Bradley C. Rundquist and Gregory S. Vandeberg

Section III. Politics

Chapter 5. Political Impact (1958), by Ross B. Talbot
Chapter 6. Political Impacts of Oil in an Era of Sustainability (2018), by Andrea Olive

Section IV. Economy

Chapter 7. The Economic Impact of Oil Development (1958), by Samuel C. Kelley, Jr.
Chapter 8. The Economic Consequences of Oil Development (2018), by David Flynn

Section V. Social Change

Chapter 9. Social Change in the Basin (1958), by Robert B. Campbell
Chapter 10. Social Impacts of Oil Development (2018), by Rick Ruddell and Heather Ray
Chapter 11. Making Home in the Bakken Oil Patch (2018), by William Caraher, Bret Weber, and Richard Rothaus
Chapter 12. Drinking, Drugs, and Long Waits: Community Members’ Perceptions of Living in a North Dakotan Boomtown (2018), by Karin L. Becker
Chapter 13. Boomtown Bias: Reflections on the Past, Present, and Future of Prostitution and Sex Trafficking in North Dakota (2018), by Nikki Berg Burin

Section VI. Conclusion

Chapter 14. Conclusion: Reading The Williston Report Sixty Years Later (2018), by Kyle Conway

Section VII. Appendices

Appendix A: Methodology Note (1958)
Appendix B: Supplementary Tables (1958)

Advertisement

The Bakken then, the Bakken now

I spent the winter break reading and correcting the text of The Williston Report, the public domain book from 1958 that will be republished (alongside updated chapters) by the Digital Press at the University of North Dakota this year or next.

I’ve also been reading a number of current books, including Bill Caraher and Bret Weber’s The Bakken: An Archaeology of an Industrial Landscape (an excellent book about which I’ll have more to say later) and Rick Ruddell’s Oil, Gas, and Crime (also excellent). Reading them side-by-side has revealed a number of points of comparison that give insight into the differences between the 1950s boom and the 2008–2014 boom. Over the next couple posts, I plan to highlight a few of them.

The first (and most revealing) is simply the scale of production. Here’s a table (derived from Samuel Kelley’s chapter, “The Economic Impact of Oil Development”) describing annual production from 1951 to 1954:

PRODUCTION OF CRUDE PETROLEUM, NORTH DAKOTA AND SELECTED AREAS, 1951–1954 (THOUSANDS OF BARRELS)
1951 1952 1953 1954
Williams County 25 1,481 4,248 4,135
Mountrail County 0 91 900 1,253
Other 0 26 218 637
North Dakota (TOTAL) 25 1,598 5,466 6,025

Here’s the updated version (from the statistics on p. xiv of “Oil In North Dakota: 2016 Production Statistics,” a report produced by the North Dakota Industrial Commission):

Granted, these reports don’t measure exactly the same thing, but the difference in scale is clear enough. The 1950s boom barely registers in comparison to the boom of the 1980s or, more dramatically, the most recent boom. Production in 1954 (in the entire state) was about 6 million barrels. Production in 2015 was more than 400 million barrels.

Soon (whatever that means!) I’ll post more points of comparison. They reveal that the effects of the most recent boom were also magnified, not surprisingly. So, more soon.

More on archival documents

For reasons I myself don’t understand, I have two blogs. I’m using this one to talk about historical aspects of my research and the other to talk about theoretical aspects. It’s an untenable distinction, but it’s heuristically useful to me as I write. At any rate, over there, I’ve posted a description of how I plan to use these historical documents. It’s called “Everything I Needed to Know about Petromodernity I Learned from the American Petroleum Institute.”

American Frontier (1953)

I’ve continued to dig through various electronic archives, looking for contemporary accounts of the oil boom in Williston in the 1950s. Tonight I hit upon gold, a 1953 film sponsored by the Oil Industry Information Committee of the American Petroleum Institute:

I’ve embedded the YouTube link here, but the film itself is available from archive.org. It’s public domain, so you can download it in various forms if you like.

I’ve just watched it, and there’s a lot to say. The theme of the frontier dominates, and the only time the narrator mentions any residents who predate the Norwegian settlers is when an oil prospector picks up an arrowhead as a good luck charm.

(Also, the film begins oddly. The first sentence, intoned over images of wind-blown prairies, is nonsense: “The wind blows west from the Great Lakes.” Anyone who has lived in Williston knows (1) the wind comes from the west and blows toward the east, and (2) the closest Great Lake is 700 miles away.)

I will come back to this film later. It’s of a piece with other documents from the Oil Industry Information Committee, which published a series of booklets for schools “designed to provide a reciprocal exchange of information and understanding between the oil industry and the schools,” according to the authors of The Williston Report, published in 1958. I’ve ordered a copy of one of those publications (thanks to AbeBooks), and I’ll revisit the film and report once the booklet arrives.

The Williston Report, 1958

Nine months ago I thought I’d put together a collaborative blog about the boom and bust in the Bakken. I spent a month or two trying to find collaborators, but I didn’t get too far. So I’m going to do something different.

About a month ago, I found the book I thought was writing. Or, almost. It’s The Williston Report: The Impact of Oil on the Williston Area of North Dakota, by Robert Campbell, Samuel Kelley, Ross Talbot, and Bernt Wills. It’s a meticulous report about the economic, political, and social changes that Williston has undergone because of the oil boom and bust. It’s full of maps, graphs, and pictures of man camps, all the things that interest me as context for understanding how oil affects people’s notions of home.

And it’s from 1958. That is, it’s a thorough (or relatively thorough—more about that in a second) account of the first boom to affect the region (before the second in the 1980s and the third in 2008-2014).

I’m now working with collaborators to update the book. We plan to republish the original report (which is in the public domain) along with essays that bring it forward sixty years. Sixty Years of Boom and Bust: The Williston Report, 1958-2018 should come out in 2018 from the Digital Press.

In the meantime I will use this blog to post the interesting bits I find as I work on cleaning up and correcting the old manuscript. The report is wide-ranging, in some places providing an excruciatingly detailed account of local politics in Williston, Ray, and Tioga, and in others, glossing over what seem to me to be major points. (Apparently, in the 1950s boom, “There were no indications available to the researchers that there had been a notable increase in, or even the presence of, organized criminal or immoral activity—gambling houses, theft rings, ‘protection’ or houses of prostitution” [p. 139]. I’m a bit skeptical.)

For right now, though, I’d like to share a comment from the end of the report. The authors, it appears, found themselves in a position like that of the mythological figure Cassandra, who prophesied truth that no one would believe:

One of the unfortunate aspects of a report of this sort that some of the predictions which are practically useful are not available early enough. We could have predicted fairly accurately the amount of immediate decrease in Tioga’s population as we were conducting the fieldwork because of our knowledge that particular individuals already knew the dates on which they were to be transferred. Furthermore, we could have predicted the decrease in activity because of the knowledge we obtained about the relative number of employees needed in exploratory as compared to development activity in the oil fields. The predictions of this sort that we expressed orally tended to be ridiculed as obviously wrong or as attempts to devaluate the importance of the oil development to the state of North Dakota. This reaction, itself, would be an interesting study. (p. 143)

I wonder what scholars can say now about Williston and the Bakken that would be of interest to people in Williston and the Bakken. I get the impression that residents are tired of people like me asking them questions, and I can’t blame them. What, I wonder, would make the work I (we) do useful or meaningful to them?

The Boom Is Not Over, Part 2: Lived Experience

by Kyle Conway

If you read North Dakota’s newspapers during the boom, the picture was pretty rosy. Most (but not all) of the stories in the Williston Herald, the Dickinson Press, and the McKenzie County Farmer were positive [note 1]. The boom meant prosperity and hope, a reversal of years of out-migration. In that light, the bust looks light the end of prosperity as jobs – and people – leave.

But if you read the letters to the editor in the same newspapers, the picture was different. Long-time residents felt like they were losing their homes:

The core of our towns is being lost because the locals simply don’t want to live here anymore. They are leaving because the home they knew and loved is no more. They are leaving because they have lost their cherished lifestyle, their peace of mind, their safety – they have lost their western North Dakota. [note 2]

It should come as no surprise that residents framed their fears in terms related to home. The idea of home had undergone a rapid shift, both literally and figuratively. At a literal level, this shift related to the way people valued houses – the structures they called home. Houses are valuable in at least three ways. First, we can buy and sell them: they’re valuable as a commodity. Second, we can live in them: they’re valuable as shelter. Finally, perhaps most importantly, we can make our home in them: they’re valuable for the relationships we form with others – the bonds that link us to our family, friends, and communities.

In the Bakken, the relative weight of each of these values shifted between 2008 and 2014, as houses’ commodity value grew. The Bakken boom was typical in that it took place place when natural resources were discovered in a remote area with limited resources. When that area could not provide the necessary workers, employers recruited elsewhere, leading to rapid population growth. When community resources (related to housing, education, law enforcement, medical care, and physical infrastructure) proved inadequate, local governments looked for new sources of revenue. More jobs and higher salaries made for a bigger tax base, but they also led to inflation and increased labor costs. Community members worried about how to adapt their lives to a new social reality. Then, predictably, the bust followed, and many (but not all) newcomers left [note 3].

The increased demand for housing meant people’s houses were worth more as commodities. It also meant landlords could raise rents or sell their properties. When they did, the new owners – frequently the oil companies themselves – could raise rents or evict old tenants to make space for oil workers. Many long-time residents no longer felt a sense of what psychologists call “ontological security,” or the idea that “the stability of the world can be taken for granted” [note 4]. Their anxiety about their literal homes contributed to their anxiety about their figurative home, as the letter to the editor quoted above suggests. “Home” meant not just the structure where they lived, but the community they belonged to, linked as it was to a specific place with specific people. In the most extreme cases, they worried about where to find shelter. In other cases, they worried about the loss of “their cherished lifestyle, their peace of mind, their safety” as so many newcomers descended on the region. Sebastien Braun sums the situation up succinctly: oil turned western North Dakota into a frontier, but “frontiers exist as frontiers for outsiders, on the same land that is home to locals” [note 5].

In fact, the logic of home and housing was rather perverse: people didn’t fall through the cracks in spite of the boom but because of it, and what proved the truth of the boom’s prosperity is precisely the inability to meet residents’ needs [note 6]. A 2014 article from the Williston Herald (versions of which appeared in Time magazine and the New York Daily News) demonstrates this paradox well [note 7]. It described a survey that showed that Williston had the highest rents in the country, beating out perennially expensive places like Manhattan, Boston, and San Francisco by as much as 40 percent. Rents were rising because jobs were plentiful and people wanted to be there. Lack of housing was merely a symptom of Williston’s prosperity: the town was a victim of its own success.

The boom is not over

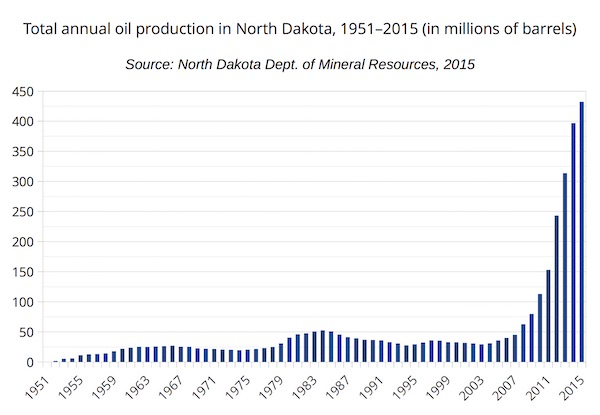
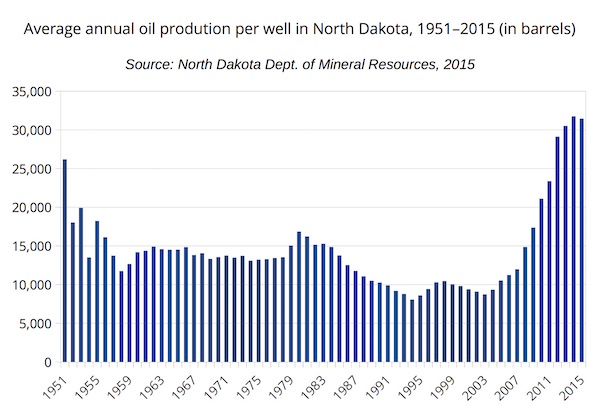
In my last post, I wrote that the continuity we see in the economics of oil extraction translates into a continuity in the ways people lived (and live) in the Bakken. What I mean is this. Rather than see booms merely as periods of economic expansion, it’s important to see how they are in fact defined by their contradictions. Because production begins to drop off in as little as a month after a well is drilled, contraction was always a factor, even during the height of the boom. It was hidden from view, but it was still a source of anxiety. People wanted to hedge against the eventual downturn, but they faced clear limits in what they could do. Likewise, the paradox I describe in this post has been (and still is) a source of anxiety. Many long-time residents felt dispossessed of their home, in both a literal and a figurative sense.

Thus when I write that the boom is not over, I do not mean that the economy has maintained the same rate of growth as in 2008–2014. What I mean is that the contradictions that shaped those years continue to operate. The main difference between then and now is they have become more visible. The effects of the ever-present contraction became clear when oil companies stopped drilling. The effects of the housing shortage were always clear for people affected by it, but they were made starker when the narrative of prosperity was harder to sustain.

And people continue to feel dispossessed of their home. That feeling certainly influenced the standoff over the Dakota Access Pipeline, at the beginning of which Sioux leaders explained, “This is the third time that the Sioux Nation’s lands and resources have been taken without regard for tribal interests. The Sioux peoples signed treaties in 1851 and 1868. The government broke them before the ink was dry” [note 8]. Of course, this comparison is far more complicated than what I can present in a blog post.

***

This is where I ask what you think. The point of these posts – and this project, really – is to see what emerges from conversation about life in the Bakken. In other words, the point is not to produce a traditional form of scholarship that constantly runs the risk of irrelevance, but to find a way to think together, collectively, to bring conflicting – and complementary – perspectives together. So, what do you think?

Notes

Note 1. Angela Cary, “Covering the Boomtown: How Mediated Communication Has Shaped Life in the Bakken Oil Region,” in The Bakken Goes Boom: Oil and the Changing Geographies of Western North Dakota, edited by William Caraher and Kyle Conway (Grand Forks: Digital Press @ the University of North Dakota, 2016), p. 257–277.

Note 2. Shelly Ventsch, “It’s Not a Matter of If Something Happens, But When,” Williston Herald, December 4, 2012. For a broader examination of this phenomenon, see Joshua E. Young, “Booms and Busts: Haunting Memories in the North Dakota Oil Boom,” in The Bakken Goes Boom, p. 71–90.

Note 3. Charles F. Cortese and Bernie Jones, “The Sociological Analysis of Boom Towns,” Western Sociological Review, vol. 8, 1977, p. 76–90. Later formulations of the boom town model have emphasized the recovery that often takes place after the bust. See Karin L. Becker, “The Paradox of Plenty: Blessings and Curses in the Oil Patch,” in The Bakken Goes Boom, p. 11–29.

Note 4. David Madden and Peter Marcuse, In Defense of Housing: The Politics of Crisis (New York: Verso, 2016), p. 68.

Note 5. Sebastien Braun, “Revisited Frontiers: The Bakken, the Plains, Potential Futures, and Real Pasts,” in The Bakken Goes Boom, p. 95.

Note 6. I’ve adapted this argument from Dominique Perron’s analysis of Alberta in L’Alberta autophage: Identités, mythes et discours du pétrole dans l’Ouest canadien (Calgary: University of Calgary Press, 2013).

Note 7. Jerry Burnes, “Williston Rents Highest in Nation,” Williston Herald, February 15, 2014.

Note 8. David Archambault II, “Taking A Stand at Standing Rock,” New York Times, August 24, 2016.

The Boom Is Not Over, Part 1: Economics

by Kyle Conway

Is North Dakota’s oil boom over?

Consider these statistics. In November 2012, there were 191 active rigs drilling new wells in North Dakota. A year later, in November 2013, there were 181. November 2014: 188. November 2015: 64. November 2016: 38 [note 1]. The state’s oil boom, these statistics suggest, peaked in 2014, and now, only two years later, it’s clear the state’s in a bust.

Now consider some competing statistics. In 2012, North Dakota produced a little more than 240 million barrels of oil. In 2013, that number rose to about 314 million. In 2014: 397 million. In 2015: 432 million [note 2]. (See Figure 1.) Not only that, but oil production in 2015 was more than eight times what it was at the height of the last boom in the 1980s. These numbers tell a different story: whatever the decline in active rigs, the boom is still kicking.

Total annual oil production in North Dakota, 1951–2015

Figure 1

So which is it – is the boom over or not? These statistics suggest that the answer is not a simple either/or. If we define a boom merely as an expansion of production (and a bust as a contraction), we miss the more complex relationships between drilling, oil production, and oil revenue. The contraction the Bakken has experienced since 2014 was built into its boom from the beginning. It was always taking place, even during the peak years of 2008–2014, because wells quickly became inefficient. It was just hidden by the furious pace of drilling. When oil prices dropped, that pace became unsustainable, and the contraction that was always imminent became real.

In this post and the next, I want to explore the implications of this observation. I argue that the boom is not over, in at least two senses. First is that of economics: as I suggest above, the boom from 2008–2014 was premised – paradoxically – on a contraction. Oil companies could postpone it, but they could not escape it. In that sense, the fundamental conditions of oil extraction have remained the same. What’s more, the bust – even now – has boom-like qualities, as production remains at near-record levels. In this sense, the terms North Dakotans use are misleading. The passage from expansion to contraction has been characterized by far more continuity than words like “boom” and “bust” seem to imply.

The second sense is that of people’s lived experience. This will be the topic of the next post. But in short, my argument is this: economic conditions (and contradictions) have a profound impact on people’s lives, and the continuity we see in the economics of oil extraction translates into a continuity in the ways people live in the Bakken.

My point is to raise questions as much as to answer them. If I’m being polemical (and I am), it’s to provoke reactions. I hope this is the beginning of a conversation. Think I’m wrong? Tell me why. Click on the “contact us” tab above and send me a message. We (the editors of this site) would love to have your contribution.

The built-in contraction

What does it mean to say that the boom was premised on a contraction? Fracked wells produce oil most quickly during the first month after they come on line. After a year, their production drops as much as 50 percent, and after two years, as much as 70 percent. As a result, during the height of the Bakken boom, oil companies had to drill about ninety new wells a month just to hold production steady [note 3], and the number of active wells ballooned from about 4,200 in 2008 to more than 13,700 in 2015 [note 4]. (See Figure 2. For a useful point of comparison, note that there were about three and a half times as many wells in 2015 as there were at the height of the 1980s boom.) In other words, many of the jobs created during the boom were those of the people who worked the drilling rigs. Their work was in demand because oil companies knew the wells they drilled would slow down in a relatively short time.

Total number of active wells per year in North Dakota, 1951-2015

Figure 2

At the same time, however, the technology for extracting oil from shale was becoming more efficient: steerable rotary bits, multipad drilling (where “multiple descending wells from a single surface location eliminate the need for rig transfers between locations”), and zipper fracking (where “two or more parallel wells are drilled by perforating each at alternating intervals”) made it possible to drill wells faster and extract more oil from them [note 5]. In the Bakken, these improvements translated into wells that produced twice as much oil annually than those from the 1980s boom [note 6]. (See Figure 3. Note that the statistics from the 1950s are thrown off by the fact that there were very few wells, which has the effect of inflating the annual average production per well.)

Average annual oil production per well in North Dakota, 1951-2015

Figure 3

So is the boom over?

What we have is a set of factors that push and pull on each other. On the one hand, drilling is down 80 percent from its peak in 2012–2014. On the other, wells are more efficient than in the past, even if their productivity does drop off over time. On top of that, the state has more wells than ever, producing more oil than ever. So even if the industry is not expanding at the same pace as before, its contraction doesn’t seem as dire as the gloomy headlines would suggest.

Of course, rates of drilling and production are only part of the story. The price of oil is another. Its precipitous drop in 2014 caused the drop in drilling – the break-even point for oil companies was about $85 a barrel. Any less and new wells weren’t profitable [note 7]. Cheap oil also hurt North Dakota’s tax revenues. Despite the fact that production remained high, the state had to cut its budget in 2016 because its revenue predictions didn’t account for the falling price of oil [note 8]. And yet, that too could change, according to Harvard’s Leonardo Maugeri: “shale activity can be resumed outright if oil prices later would resume their upward climb” [note 9].

So where does that leave North Dakotans? How have longtime residents and the people who came during the boom experienced the push and pull of the different factors that shape oil production in the state? That will be the topic of my next post.

Notes

Note 1. North Dakota, “Current Active Drilling Rig List,” Bismarck: North Dakota Industrial Commission, Department of Mineral Resources, 2016.

Note 2. North Dakota, “Oil in North Dakota: 2015 Production Statistics,” Bismarck: North Dakota Industrial Commission, Department of Mineral Resources, 2015, p. xiv. A spreadsheet with the table from which Figures 1–3 derive is available here.

Note 3. Leonardo Maugeri, “The Shale Oil Boom: A U.S. Phenomenon,” Discussion Paper 2013-05, Cambridge, MA: Harvard Kennedy School, Belfer Center for Science and International Affairs, 2013, p. 1–3.

Note 4. North Dakota, “Oil in North Dakota,” p. xiv.

Note 5. Maugeri, “The Shale Oil Boom,” p. 8.

Note 6. North Dakota, “Oil in North Dakota,” p. xiv.

Note 7. Maugeri, “The Shale Oil Boom,” p. 14.

Note 8. See, for instance, Mike Nowatzki, “ND Tax Revenues Fall Short Again; More Budget Cuts Possible,” Grand Forks Herald, March 15, 2016.

Note 9. Maugeri, “The Shale Oil Boom,” p. 14.